

Introduction
For my first graduate school environmental analysis class project, I wanted to measure the emissions reduction that energy storage could provide. This class focused on Life Cycle Analysis (LCA). This measures the emissions and pollution of a product or energy source over its entire lifecycle. In the past I’ve looked at various aspects of energy storage. Measuring the effects of energy storage on greenhouse gas emissions seemed like the perfect combination of these two areas.
SB700 CA Energy Storage Mandate
I chose to focus on the SB700 bill in California that passed the Senate and is currently postponed for the Assembly until next year. It’s a fairly straightforward mechanism to offer $1.4 Billion in the form of rebates to energy storage devices. It would run from 2018-2027 and be funded by fees to customers as most energy programs are through an increased rate base. It will be carried out through the California Energy Storage Initiative program. The general premise as described is to –
“The distributed energy resource technology shifts onsite energy use to off-peak time periods or reduces demand from the grid by offsetting some or all of the customer’s onsite energy load, including, but not limited to, peak electric load.”
and
“Make energy storage mainstream”
There are a few biggest uncertainties with the biggest being how much will be offered for each device or MWh? I’ll leave this question alone since I’ll only be focusing on the overall effect of the bill. Looking at the text of the bill, there are a few important points to note:
- There is an additional 20% available for products manufactured in the state of California.
- Must use existing transmission and distribution systems.
- Must be made available to all ratepayers.
-This point and the previous point are a big deal as they don’t allow for distributed energy that is not connected to the grid. This propogates the centralistic nature of the grid allowing less independence for individuals. It also doesn’t support storage in more disconnected sites. - “Dispatch capable”
-This is a concern becuase financial incentive may or may not be in-line between the owner and utility. There is a disconnect between who is paying for the storage (customers) and who is receiving the benefit (utility or CAISO). - Success based on reduction in GHG emissions, and other emissions.
-If this is the core goal of the $1.4 Billion, it’s worth investigating how much of an impact can be had. This is the core question of my research investigation.
Does Energy Storage Reduce Greenhouse Gas (GHG) Emissions?
Set-up
This is an important question because although energy storage is hailed as the savior of solar and wind, it isn’t immediately apparent that adding storage will immmediately lead to a reduction in GHG Emissions. This is because:
- Storage is not a source of energy itself. It still requires generation from somewhere and that primary source may generate greenhouse gases.
- Storage results in a loss in efficiency. The amount of energy you get out of a storage device is never as much as you put in. This means that you are having to generate more energy from somewhere.
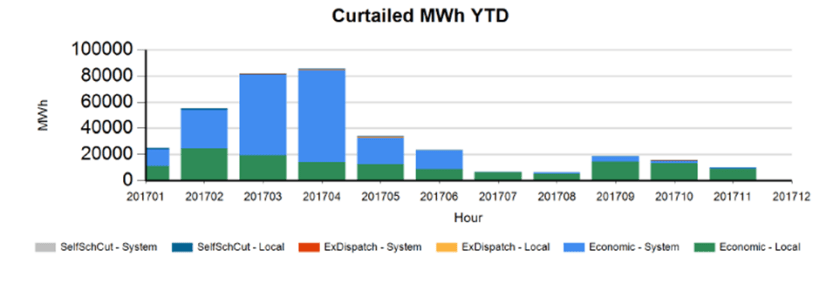
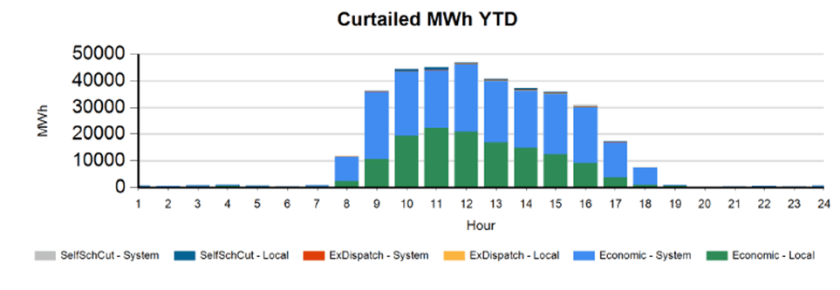
The way that it can lead to decreased emissions is by changing the electricity production bundle in a positive way. After a little research on CAISO operations, it becomes apparent that the first step in doing this is by reducing the curtailment of renewables. Curtailment is happening in CA when the grid is not able to properly use all the renewable energy being produced. The following two graphs show when this is happening by month –
and by hour –
Analysis
The overview of my analysis is to define how much CO2 is produced in a day based on a typical energy mix profile and then compare that to an energy mix profile with a greater percentage of solar.
To start, $1.4 Billion can buy you 3.5GWh of storage at a price of $400/kWh. Since I’m taking a focus on taking advantage of solar and wind being curtailed, I measure the curtailment size per day in the maximum month of June to be: 85,000 MWh / 30 days = 2,833 MWh (2.83 GWh) per day. This is the limit of the size of energy that can be moved since it’s the smaller of 3.5GWh and 2.83GWh. I randomly pick a day when deciding the amount of energy California uses in a day to be 620 GWh. Dividing the 2.83 GWh stored curtailment by the 620 GWh daily use gives .456% storage size as percentage of daily use. This can be re-attributed from fossil-fuel to wind and solar. The renewable energy being curtailed and wasted during the day can be stored until the peak load hours of the afternoon. The .456% storage size percent of daily use and 620 GWh daily use will be used as the inputs in GREET.
GREET

GREET is a Life Cycle Analysis (LCA) analysis tool developed by Argonne National Labs. It By analyzing the inputs and production that goes into producing a product, generating energy, or operating a vehicle, it outputs numbers on emissions and pollution. In regards to energy, it’s a fairly straightforward process of setting the percentage source mix of generation, distribution pathways, and the amount of energy. GREET then outputs pollution quantities.
Plugging in the daily production of 620 GWh and using the base electricity generation mix that GREET assumes, I get a pollution level of 206,282 tons of CO2. In my increased storage case, I reduce coal and NG by .228% each (.456% / 2), and increase a solar plus storage source .456%. This source includes a 80% battery efficiency pathway. This results in 204,165 tons of CO2 produced. In a third case scenario, I assume that storage costs are reduced to $200/kWh making the total storage size 7GWh. I assume that this is able to be fuly used because there is also increased solar or wind made available. This best case scenario gives a result of 201,022 tons of CO2. The percentage generation mix in this scenario is shown in the following pie graph.

The results of the analysis are summarized in the following table. The columns contain the carbon output in a day, how much carbon is saved over 15 years, and the cost of that carbon reduction based on the $1.4 Billion.
| Scenario | Storage Size | tCO2 | tCO2 Reduced over 15 years | Cost per tCO2 |
| Base Case | 0 | 206,282 | ||
| Storage | 2.83 GWh | 204,165 | 11,590,575 | $120 |
| Storage Best Case | 7 GWh | 201,022 | 28,798,500 | $49 |
As you can see the $49-$120 cost to reduce a ton of CO2 is in the low to middle range for the estimate of the social cost of carbon. Based on these assumptions, storage can be an effective mechanism for reducing GHG emissions when properly coupled with clean energy sources.
Reflection
There are a few caveats about this analysis. The biggest is that it makes some gross simplifications. Storage is very complicated as to the effect that it can have, but I employ it in a simplified manner in order to keep things simple when studying its effects. There are many different ways to get value from storage that are more complicated than hourly energy shift. How the storage is employed can make a big differnet as to the carbon reduction effect it will have.
The other uncertainty comes from the input assumptions I used. I tried to make reasonable assumptions and research the numbers used; however, many of these numbers have a wide range or are difficult to estimate such as curtailment or daily energy use. Others numbers such as the cost of storage continue to fall and change quickly.
More important than the exact numbers is the understanding of the mechanism by which storage is able reduce carbon emissions. Storage is able to reduce carbon emissions in spite of the downfalls of reduced efficiency and the fact that it is not itself a source of generation. As more solar and wind come onto the grid with falling prices, storage will be able to ensure the reliability of the grid with reduced GHG emissions.
