
My first project is to predict energy production of a solar panel. I got my hands on an energy dataset that compares temperature and daylight to energy production (I’m assuming this is energy production of solar panels) of houses. It is monthly frequency over two years. This is from Cambridge Energy Lab’s Challenge. The ultimate goal is to be able to predict Energy Production from the data on an entirely new house. To start off, we’re going to do some data exploration to get a better sense of the data.
The data itself looks like as follows:

Label: 0-22 index repeated for each house
House: 500 houses represented
Year/Month: 2011/7-2013/5
Temperature: Degrees Celsius
| Statistic | Value |
|---|---|
| Count | 11,500 |
| Mean | 14.37 |
| Stdev | 8.49 |
| Minimum | 0.8 |
| 25th Percentile | 5.3 |
| 50th Percentile | 13.2 |
| 75th Percentile | 22.8 |
| Maximum | 29 |
Daylight: How much daylight. Not sure of the units.
| Statistic | Value |
|---|---|
| Count | 11,500 |
| Mean | 189.12 |
| Stdev | 29.43 |
| Minimum | 133.7 |
| 25th Percentile | 169.1 |
| 50th Percentile | 181.8 |
| 75th Percentile | 205.2 |
| Maximum | 271.3 |
EnergyProduction: (kWh)
| Statistic | Value |
|---|---|
| Count | 11,500 |
| Mean | 612.75 |
| Stdev | 142 |
| Minimum | 254 |
| 25th Percentile | 509 |
| 50th Percentile | 592 |
| 75th Percentile | 698 |
| Maximum | 1254 |
These preliminary statistiscs give us a nice idea of what the magnitude and range of the data is, but quite frankly, nothing we couldn’t have gotten from a quick browse through of the raw data.
And to get a preliminary scatter plot with Temperature vs. Energy Production:
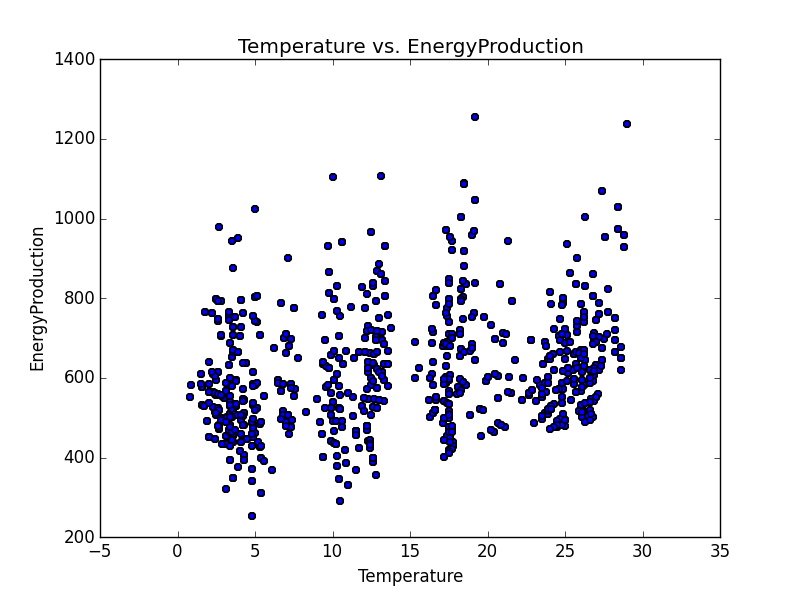

There’s is not a very clear linear relationship here. There might be some clustering to be done as there seems to be diferent groups the data could be put into.
And graphing the Daylight variable:

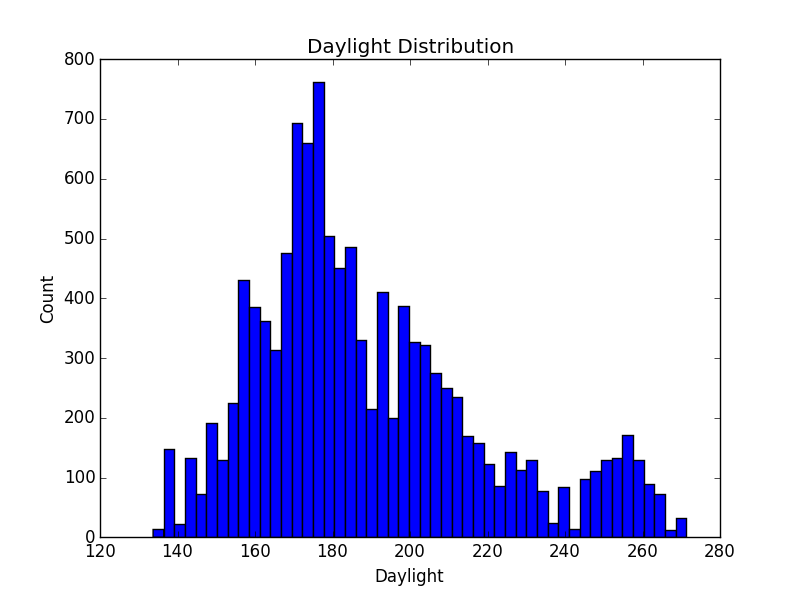
The Daylight dependent scatterplot seems to show data that is ripe for linear regression. This is something that should be investigated.
An important part of the data that I originally overlooked are the months. Graphing the Energy Production month by month over a year, should give a fair amount of information. This is because weather is very dependent on what month it is, and Energy Production is very dependent on weather. In theory.
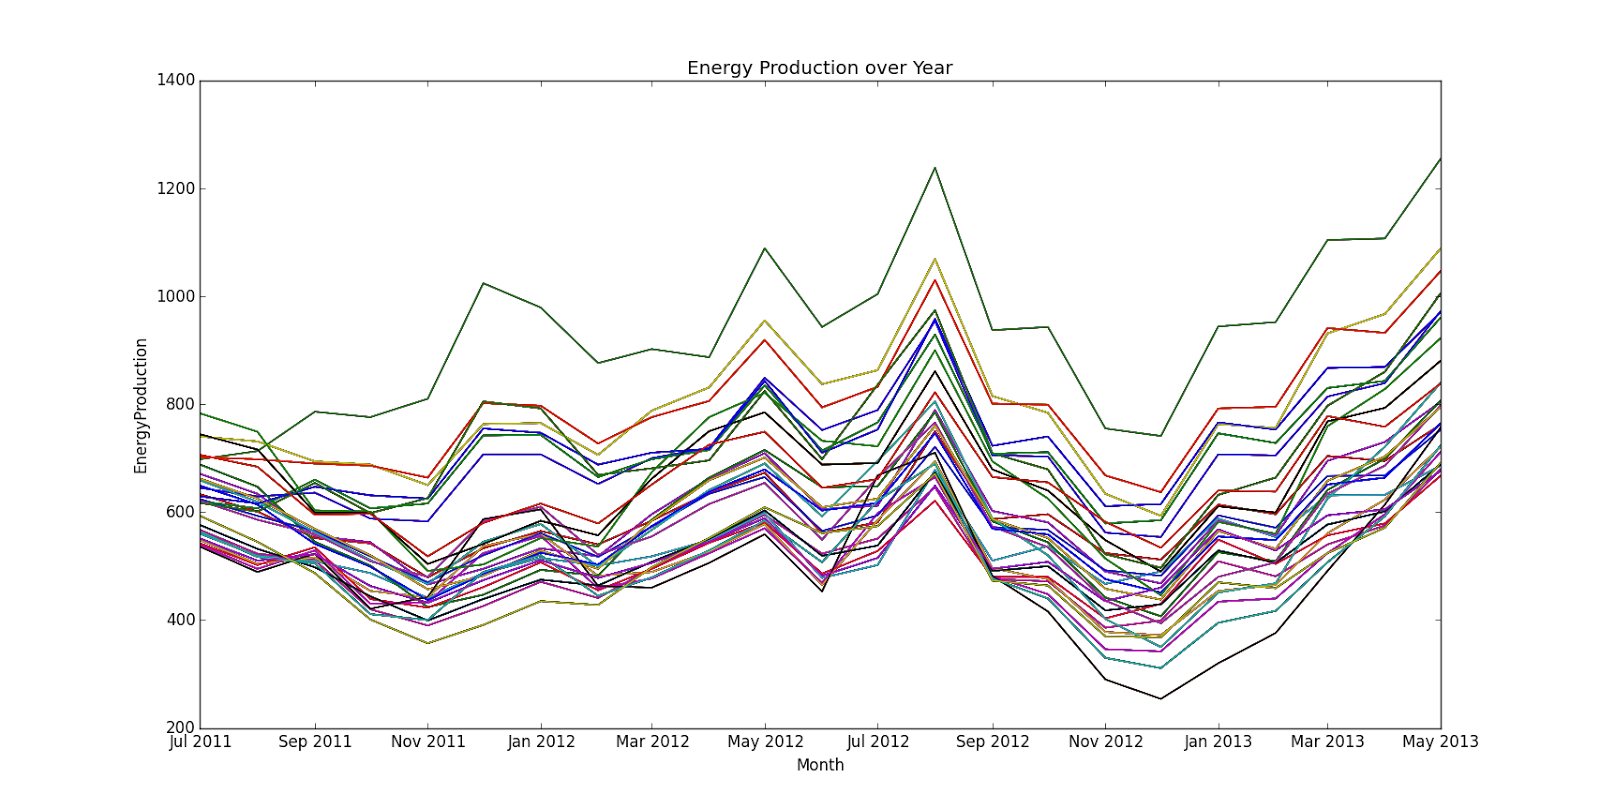
There seems to be some correlation month to month. I’m not sure how able a month would be able to tell us what Energy Production to expect, but the better information might be what type of change to expect from the previous month. I’ll have to think about this and see what can be done.
In summary, this post gives a cursory information of what the data is we are working with. The key will be in what steps we take next. There is a great number of different analysis we could perform from linear regression relating Temperature or Daylight to EnergyProduction, to K Means clustering to group the houses in an effort to try and differentiate them. We’ll have to be smart about the next steps, but in the end need to try something and see how it works.
